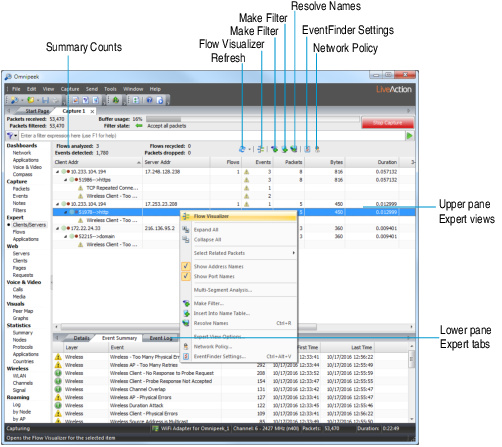
Expert views and tabs
The Expert view of a capture window has two data areas. The upper pane displays conversations or flows in the following formats:
The lower pane contains three tabs which present additional information about the selected rows in the upper pane:
NOTE: The terms “conversation,” “stream,” and “flow” are synonymous. For example, the end-to-end IP address and UDP or TCP ports form a unique conversation, stream, or flow for a given application.
The parts of the Expert view window are identified below.

• Flows analyzed, Events detected: Shows summary counts in this capture.
• Flows recycled, Packets dropped: Shows summary counts which relate to the Expert’s use of memory. See Expert memory usage.
• Refresh: Updates the Expert with the latest packet information contained in the capture buffer. You can also choose a refresh interval from the drop-down list.
• Flow Visualizer: Displays the Flow Visualizer, which presents a variety of ways to look at individual flows from the Packets, Expert and Web views, providing a static snapshot of the packets that were in the buffer for a particular flow at the time the window was created.
• Make Filter: Opens the Insert Filter dialog to create a filter based on the selected packet.
• Insert Into Name Table: Opens a dialog to add the selected item into the Name Table. From the dialog, you can also select Node type icons that will appear to the left of the selected packet. For example, Workstation, Server, Router, or Access Point.
• Resolve Names: Checks the DNS server for a name to match the supplied address.
• Expert EventFinder Settings: Opens the Expert EventFinder Settings window, in which you can configure individual expert events. See Expert EventFinder.
• Network Policy: Opens the dialog, in which you can configure expected behavior for the program and compare this to actual events. See Network policy settings.
• Right-click options: These options include:
For a complete list and description of the columns available in Expert views, see Expert view columns.
TIP: To toggle this option directly in the Expert views, on the menu, point to , and then click .